Tools and guides · Examples
Claude artifact examples you can open and use.
A Claude artifact is a document or small app that Claude builds in a chat. The six below are each one HTML file, sent as live HTMLRadar links: open each one, click through it, and copy the prompt that made it.
Updated 30 September 2026
What each one does that a PDF cannot, and the prompt that made it.
Claude made each page from the prompt shown, exactly as it was used. Each was uploaded to HTMLRadar and sent as a link anyone can open, so you can try it.
Selling
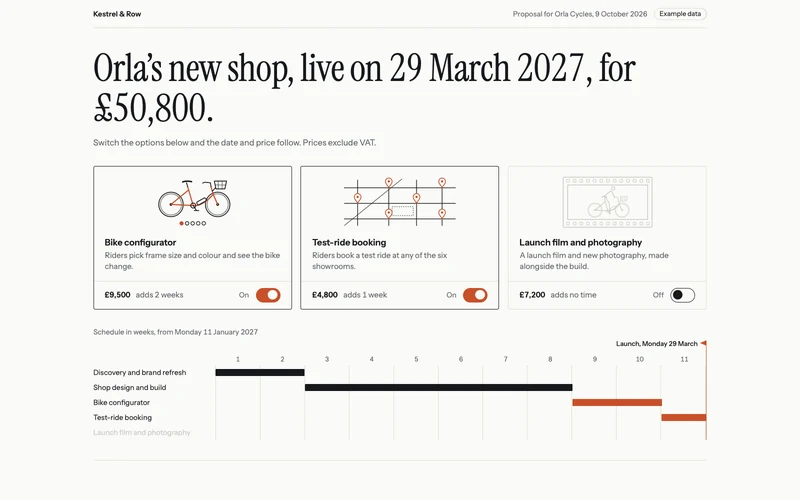
Client proposal
For agencies and consultancies who want the client to shape the deal as they read it.
Open it live (Client proposal, new tab)What a PDF cannot do
The client switches options on and off, and the price, the launch date and the schedule change with them.
The prompt, 1258 words
Make a client proposal as one self-contained HTML file, from Kestrel & Row, a small digital studio, to Orla Cycles, a maker of city e-bikes with six showrooms, for a new online shop. It is sent as a link to Orla's Head of E-commerce. The one idea the whole page serves: the client shapes the deal as they read, and the price and the launch date answer back at once. The first screen (the showpiece, on a laptop fully visible without scrolling; on a phone it starts on the first screen and ends within the next): - A thin top line: "Kestrel & Row" on the left; on the right "Proposal for Orla Cycles, 9 October 2026" and an "Example data" label. - One live sentence set very large, the page's headline: "Orla's new shop, live on 29 March 2027, for £50,800." The date and the price are the only parts that change; when they do, the digits roll to the new value and a short rust underline sweeps under the part that changed. Punctuation stays attached to the word before it, so a comma or the full stop never starts a line on its own at any width. Under the sentence, one small line: "Switch the options below and the date and price follow. Prices exclude VAT." - Three options the client switches on and off, each a large tappable card with a drawn picture across its top, a short name, one line on what it is, then a bottom row with its price and what it adds to the schedule on the left and a clear on or off switch (not a tick box) pushed to the right, its right edge lined up with the right edge of the card's text. Above that row a hairline runs the whole width of the card, from its left border to its right border. The three cards are built the same way, and the bottom rows line up across them on a laptop. The pictures are fine-line ink drawings in inline SVG, 96 px tall, with rust as the only colour: for the configurator, a well-proportioned side view of a city e-bike (two equal wheels; a step-through frame whose tubes meet at the crank and at the seat post; the saddle on top of the seat post; handlebars on the head tube above the front wheel; the battery on the down tube; a basket in front of the handlebars) with a row of five colour dots under it, its frame drawn in rust; for test-ride booking, a small street map with six showroom pins; for the film, a film frame around a rider on the same bike, with sprocket holes along the top and bottom edges. When a card is off, its picture turns to pale grey lines and its frame colour goes; when it is switched on, the rust comes back. The options: "Bike configurator" (riders pick frame size and colour and see the bike change), £9,500, adds 2 weeks; "Test-ride booking" (book a ride at any of the six showrooms), £4,800, adds 1 week; "Launch film and photography", £7,200, adds no time because it runs alongside the build. The page opens with the first two on. - Under them, the schedule as a week grid, weeks 1 to 11 starting Monday 11 January 2027, with one bar per workstream: "Discovery and brand refresh" weeks 1 and 2 and "Shop design and build" weeks 3 to 8 (the core, always there, in ink), then the add-ons in rust: the configurator two weeks after the build, test-ride booking one week after that, and the film across weeks 5 to 8. A small flag marks the launch at the end of the last bar. Switching an add-on on grows its bar in from the left and slides the flag; switching it off shrinks the bar away and the later bars close the gap. - On a laptop the sentence spans the top, with the three cards beside each other under it and the schedule under them; on a phone the cards stack. On a phone only, a slim bar fixed to the bottom of the screen repeats the total and the launch date while the cards or the schedule are on screen, and changes with them. The figures (all invented; they must agree everywhere): the core is £36,500 (discovery and brand refresh £12,500, shop design and build £24,000) over 8 weeks. Launch is the Monday after the last week: 8 weeks, 8 March; 9 weeks, 15 March; 10 weeks, 22 March; 11 weeks, 29 March 2027. Every combination: none £36,500, 8 March; film only £43,700, 8 March; booking only £41,300, 15 March; configurator only £46,000, 22 March; configurator and booking £50,800, 29 March; configurator and film £53,200, 22 March; booking and film £48,500, 15 March; all three £58,000, 29 March. Prices exclude VAT. The rest of the page, in this order: - What we heard: three short points from the first call (online orders are 11% of sales; riders want to try before they buy; the current shop cannot show the 14 frame colours). - How we will work: the five workstreams, each with two or three deliverables in one line. - Payment, live with the options: 40% on signing, 30% at design sign-off, 30% at launch, with each amount and the total, all updating as the options change. - Who you will work with, by role only: a lead designer, an engineering lead and a producer, one line each. - Two past projects, one line each with one result: a furniture maker whose online sales rose 38% in six months; a coffee roaster whose subscriptions doubled in a year. Invented, and not named beyond "a furniture maker" and "a coffee roaster". - Next step: "Accept by Friday 23 October to hold the 11 January start." Under it, one line restating the options chosen, the total and the launch date, updating with the options. A button, "Accept this scope", opens an e-mail to studio@kestrelrow.example whose subject names the proposal and whose body lists the options chosen, the total and the launch date. - A note at the bottom that Kestrel & Row and Orla Cycles are fictional. Design: it should look like a sharp independent studio made it, not a template and not a slide deck. Clean white paper (#FAFAF7), near-black ink (#16181D), and one accent, a warm rust (#C8502A), used only for the add-ons, the changed-value underline and the flag. Instrument Serif for the sentence and the section headlines, Instrument Sans for everything else, from Google Fonts, with tabular figures. A strong type scale, generous space, fine hairline rules between sections, no cards except the three options, no drop shadows, no icons, no gradients, no pictures other than the three in the cards. Each section opens with its headline alone, with no small capital label above it. On a phone the sentence is at least 34 px and wraps cleanly; the week grid stays readable, with week labels at least 12 px, by showing every other week number if needed, and never scrolls sideways. Motion is quick and calm. For people who prefer reduced motion nothing animates: values, bars and the flag change instantly. Everything works by touch and keyboard (build each card as a label wrapping a real checkbox shown as a switch, with its state announced, not as a button element, so Safari stretches its rows: the hairline spans the card and the switch sits at the right), on a phone at 390 px wide with no sideways scrolling and on a large laptop screen. Add nothing this brief does not ask for.
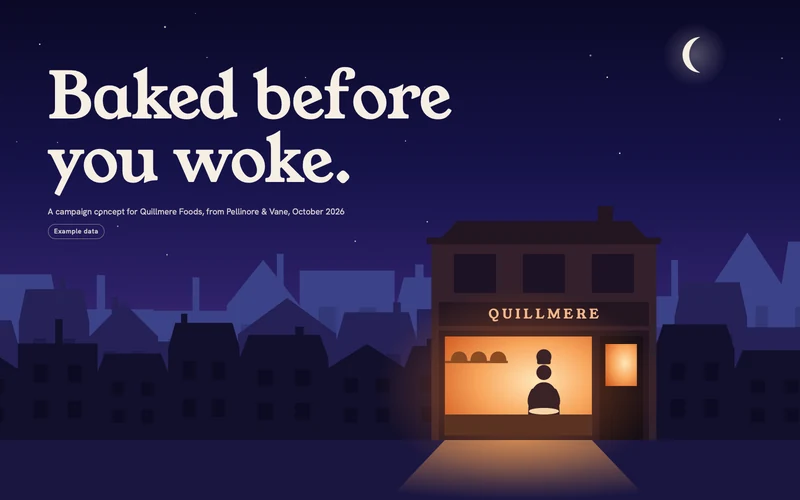
Campaign concept
For creative agencies presenting a campaign to a client.
Open it live (Campaign concept, new tab)What a PDF cannot do
Drag a slider to compare the old pack with the new one, and watch the storyboard play.
The prompt, 1009 words
Make a campaign concept as one self-contained HTML file, from Pellinore & Vane, a creative agency, to Quillmere Foods, a chain of 14 bakeries whose bakers start work at four every morning in every shop. The idea: "Baked before you woke." The page is how the agency presents the idea to the client, so the pictures do most of the talking. Draw every image yourself in inline SVG and CSS; no image files, no external requests except Google Fonts. The first screen: a drawn night street that fills the whole viewport, with the line "Baked before you woke." set very large over the sky. The sky is graded from deep indigo at the top to violet at the rooftops, with a thin crescent moon, small (no taller than the headline's capital letters) and high on the right, clear of the headline, and a few slowly twinkling stars. Three rows of terraced houses stand one behind another, the far row paler and bluer, the near row darkest, and they move at slightly different speeds as you scroll (a gentle parallax). The Quillmere bakery is the largest building, right of centre in the near row, its shopfront about a quarter of the screen width on a laptop and half on a phone, and is the only lit shop: its window glows warm, the light spills out as a soft warm wedge across the pavement, and inside the baker's silhouette kneads dough in a slow loop. Small print: "A campaign concept for Quillmere Foods, from Pellinore & Vane, October 2026", and an "Example data" label. The pavement runs straight into the next section with no band or edge between them. Then, in this order, all content invented: - The pack (the showpiece interaction, right after the first screen): a before-and-after slider the client drags (or moves with arrow keys) between today's bread bag and the proposed one, both drawn at the same size, small enough that the whole bag fits on a laptop screen at once (at most 70 percent of the screen height), and both clearly bread bags: a soft pillow shape, a gathered top closed with a clip, and a clear window showing the sliced loaf inside. Today: glossy plastic with red and yellow stripes, clip-art wheat and a "FRESH!" starburst. Proposed: matte indigo paper, a small rising-sun mark, a quiet "Quillmere" wordmark, and a printed stamp with the bake time and shop, "Baked 04:12, Harrowgate Road". The two bags stand on a pale, warm flour-white panel with rounded corners, so the indigo bag stands out clearly against it; the slider's dividing line runs down that panel, and its round drag handle sits at the foot of the panel, below the bags, so it never covers the wordmark or the stamp. Under it, the three changes in one line each. - The film: an animated storyboard of the 30-second advert with six frames that play in order, five seconds each, with play and pause, previous and next, a progress bar and a row of timecoded frame buttons. Each frame is a drawn scene with its own gentle motion and a voice-over line, and each shows the sky (through a window when indoors), so the six skies run continuously from night to dawn: 1. 04:12, midnight indigo with stars: a street, one bakery window lights up. 2. 04:40, deep indigo seen through the bakehouse window: the oven door opens and its glow fills the frame. 3. 05:30, blue-violet, the stars gone, through the window: loaves on racks with steam rising. 4. 06:15, blue with a rose band at the horizon: the shop shutter rolls up. 5. 07:05, apricot first light low over the rooftops: a commuter carrying the new bag walks past the lit shop. 6. End card, pale gold morning: a large sun, a fully opaque disc about a third of the frame's width in solid oven orange with a soft apricot glow around it, clears the rooftops behind "Baked before you woke." - The insight, in two or three short sentences: only 1 in 5 customers know the bread is baked in the shop they buy it from; the bakers' 4 a.m. start is the story nobody tells. Show the number as a drawn scene as wide as the text column: a bakery shelf with five loaves, only one of them glowing. - Where it runs: three placements, each with a time of day and a drawn scene as wide as the text column: a loaf on a shop counter with its label reading "Baked 04:12"; a bus shelter on a pavement at dawn with a poster reading "Baked 04:12 this morning"; a radio on a kitchen table in morning light with moving sound waves, for a breakfast radio spot. - Next step: approve the route by 17 October so the packs can be printed for January, with a reply button to studio@pellinorevane.example. - A note at the bottom that Quillmere Foods and Pellinore & Vane are fictional. Design: an agency's showpiece, not a template. The page itself travels from night to dawn as you scroll: the opening is deep indigo, the middle warms, and the last section is a clear apricot morning. Young Serif for the headlines and Hanken Grotesk for the text, from Google Fonts. Illustrations in flat, confident shapes with a limited palette: indigo, violet, oven orange, crust brown, flour white and dawn apricot; light in the drawings comes from soft radial gradients, never flat see-through shapes. On a phone the storyboard becomes square so the pictures stay large. Each section opens with its headline alone, with no small capital label above it. Generous space, big imagery, no drop shadows, no icons beyond the player controls. Motion has purpose and stops completely for people who prefer reduced motion: nothing animates, the parallax is off, and the storyboard does not play by itself and changes frames only when asked. Everything works by touch and keyboard, on a phone at 390 px wide with no sideways scrolling and on a large laptop screen. Add nothing this brief does not ask for.
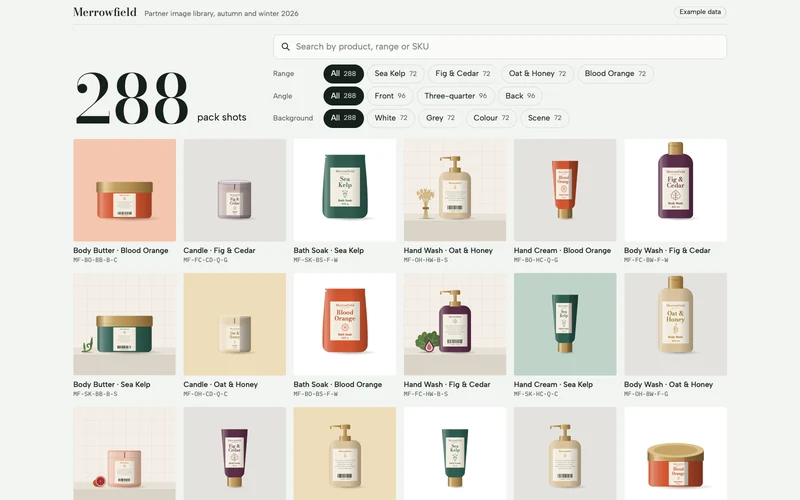
Product image library
For brand managers who share hundreds of pack shots with the retailers who stock them.
Open it live (Product image library, new tab)What a PDF cannot do
Search and filter 288 pack shots down to the one you need, then open it large with its file details.
The prompt, 1589 words
Build a product image library as one self-contained HTML file with no external libraries, for Merrowfield, a British bath and body brand, to share its pack shots with the retail partners who stock it. A partner's buyer or web editor opens it to find the right pack shot fast and take it away. Draw every product image yourself in inline SVG, generated in code; no image files, no external requests except Google Fonts. The whole file stays under 1.5 MB. The one idea the whole page serves: the count is the headline. A very large number at the top says how many pack shots match, starting at 288, and it rolls down as the reader searches and taps filters, until the one they need is in front of them. The library (all invented; every count on the page comes from this data, so the numbers always agree): - Four ranges, each with its packaging colour: Sea Kelp (deep sea green, #2F5D50), Fig & Cedar (plum, #5B2E48), Oat & Honey (warm oat, #D8C29E, with honey gold #C98B2B), Blood Orange (#D2552F). - Six products in every range, each a distinct drawn shape: Body Wash 300 ml (a tall rounded bottle with a flip-top cap), Hand Wash 250 ml (a shorter bottle with a pump), Hand Cream 75 ml (a tube standing on its cap), Body Butter 200 ml (a wide, low jar with a lid), Bath Soak 500 g (a soft stand-up pouch: a flat-topped, crimped heat-seal band across the top with a small tear notch at one corner, sides that curve gently outward, and a slightly wider, rounded base; never a dome or a canister), Candle 220 g (a glass tumbler with visible wax and a wick). Bottles, tube, jar and pouch are in the range colour with brushed brass caps, lids and pumps (#B8955A, with a soft metallic highlight). Each carries a tall cream label with "Merrowfield" in a small serif, the range name set large enough to read in a laptop tile, a fine line drawing of the range's plant (kelp fronds, a fig leaf, an oat stalk, an orange half), and the product name and size at the foot. The candle is a clear glass tumbler tinted with the range colour, cream wax, a black wick, and the same label. - Three angles: Front; Three-quarter (the pack clearly turned about 40 degrees: a wide, darker side face on the right takes about a third of its width, the label wraps round and is cut off by the turning edge, and the top of the cap or lid shows as an ellipse, so it never looks like the front view; no line, seam or highlight ever runs past the pack's own outline, which must stay clean when the image is shown large); Back (a back label with lines of small grey text, the plant drawing small, and a barcode). - Four backgrounds: White (pure white); Grey (soft studio grey, #E4E2DE); Colour (a clearly coloured backdrop per range: Sea Kelp on sage #BFD3C8, Fig & Cedar on dusty rose #E3C9D3, Oat & Honey on wheat #EEDDB9, Blood Orange on apricot #F4C6AE); Scene (a pale stone ledge against a softly tiled wall in a warm off-white, with one drawn prop beside the pack about half the pack's height, by range: a curl of kelp, two fig leaves and a halved fig, a bundle of oat stalks, a halved blood orange). - That is 4 × 6 × 3 × 4 = 288 images. Each has a SKU built as MF-{range SK, FC, OH, BO}-{product BW, HW, HC, BB, BS, CD}-{angle F, Q, B}-{background W, G, C, S}, for example MF-SK-HC-Q-W, and a file name like merrowfield_sea-kelp_hand-cream_three-quarter_white.png. Every file is a 4000 × 4000 px PNG in sRGB, approved for partner use until 31 March 2027. - One studio light for all 288, so the library looks shot in one session: the key light comes from the upper left, each pack has a soft highlight band down its left side and gentle shading on its right, and a soft oval contact shadow falls just to the right of its base on the same floor line. The packs fill their frame like real pack shots: the body wash, the tallest, stands at about 75 percent of the image height, the jar is at least half the image width, and every other shape is scaled between them in true proportion, centred, on one floor line a little below the middle of the lower half. - The default order is a fixed, seeded mix, the same on every visit, in which neighbours differ: the first twelve images use all four ranges, all six products, all three angles and all four backgrounds, and no two images side by side share a range or a background. Filtered results keep this order. The first screen (the showpiece; on a laptop it shows the count, the search, the filters and at least two full rows of images; on a phone at 390 by 844 it shows the count, the search, all three filter rows and at least one full row of images): - A thin top line: the Merrowfield wordmark, "Partner image library, autumn and winter 2026", and an "Example data" label. - The count: the number set very large (about 120 px tall on a laptop, 64 px on a phone), with "pack shots" beside it, and, once anything is filtered, "of 288" after it. It rolls to each new value. - A search field, "Search by product, range or SKU", that narrows the grid as the reader types; every typed word must match the product, range, angle, background or SKU. A clear button empties it. - Three rows of filter chips, each row with its name first: Range (All, Sea Kelp, Fig & Cedar, Oat & Honey, Blood Orange); Angle (All, Front, Three-quarter, Back); Background (All, White, Grey, Colour, Scene). One chip per row is chosen at a time, "All" to start; tapping the chosen chip again keeps it chosen. Each chip shows how many images it would give with the other current choices, and a chip that would give none is dimmed. On a phone each row scrolls sideways inside itself, never the page. - The grid, straight under the filters: square tiles, two columns on a phone and six on a laptop, each tile the drawn pack shot with the product and range beneath it in one line and the SKU in small mono text. When the filters change, images that leave fade out and the rest glide to their new places. When nothing matches, the grid says so in one line with a button that clears every filter and the search. The grid shows every matching image; tiles are drawn as they come near the screen, so the page opens fast. Opening an image (tap, click, or Enter on a focused tile): the image grows from its tile into a large view. On a laptop the image fills most of the screen height on the left and the details sit on the right. On a phone it is a full-screen sheet: the image full width but no taller than 45 percent of the screen, then the title, then the download button and its note, all within the first screen of the sheet, and the other details below. The details: the product and range as the title, then angle, background, SKU, file name, "4000 × 4000 px, PNG, sRGB" and "Approved for partner use until 31 March 2027". The position within the current results, such as "12 of 72", appears once, between the previous and next buttons. A download button reads "Download PNG"; right under it, small, "Example page: no file is attached". Tapping it shows, in place, "In a real library, the file would download now." Previous and next buttons move through the current results; a phone swipe does the same; the arrow keys too. A close button (at least 44 px) and Escape close it, and focus returns to the tile. Below the grid, a short section, "Using these images", three one-line rules: keep the pack whole, never crop the cap or pump; use White or Grey for product listings and Colour or Scene for banners and social posts; for other sizes or formats write to partners@merrowfield.example. Then a note that Merrowfield and every product are fictional. Design: it looks like Merrowfield's own site, calm and tactile, where the drawn packs are the colour. A cool, faintly green off-white background (#F2F4F1), never cream, deep green-black ink (#16211C), hairline rules (#D5DBD6), and the ink as the colour of a chosen chip, with paper-coloured text on it. Bodoni Moda for the count and headings, Albert Sans for text, IBM Plex Mono for SKUs and file names, from Google Fonts, with tabular numbers in the count. No small capital label above any heading, no cards with shadows, no gradients outside the drawings, no icons beyond the search, clear, close, previous and next controls. The search field's text is at least 16 px so a phone does not zoom. Motion is short and purposeful; for people who prefer reduced motion nothing animates: the count, the grid and the large view change instantly. Chips are real buttons with their state announced, tiles are real buttons, the large view is a proper dialog, and everything works by touch and keyboard, on a phone at 390 px wide with no sideways scrolling and on a large laptop screen. On a laptop the close button sits fully inside the details panel, with at least 16 px clear on every side. Add nothing this brief does not ask for.
Reporting
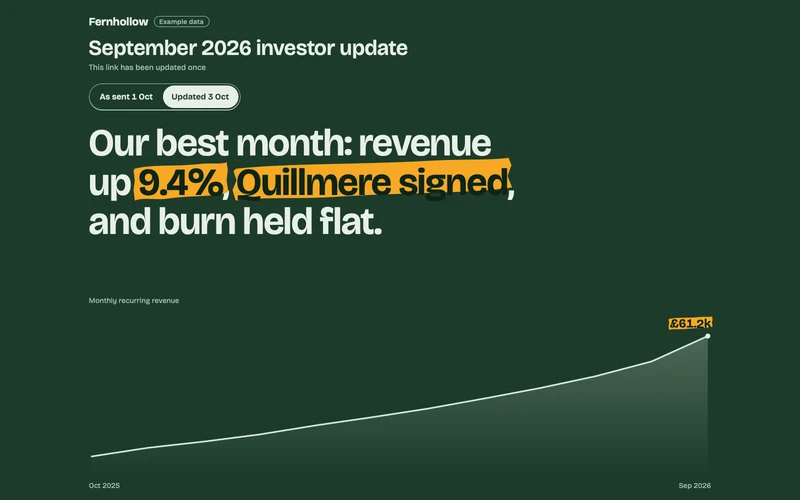
Investor update
For founders who update the same investors every month.
Open it live (Investor update, new tab)What a PDF cannot do
It stays current on the same link: switch between the version you sent and today's, and see exactly what changed.
The prompt, 1041 words
Make the September 2026 investor update for Fernhollow, a seed-stage company that sells stock and ordering software to restaurants and bakeries, as one self-contained HTML file. It goes to the company's investors as a link, and the founders update it on the same link, so the page itself must show that it is current. The first screen (the showpiece, fully visible without scrolling on a phone and a laptop): - A deep fern green hero exactly one screen tall. The top part stacks compactly from the top, with no empty band: "Fernhollow" with an "Example data" label on the same line; "September 2026 investor update"; a small line "This link has been updated once"; the version switch; the sentence. The chart fills everything below them to the bottom edge. Nothing in the hero moves or reflows when the version changes except the figures and words that change. - A two-state version switch, "As sent 1 Oct" and "Updated 3 Oct". This is the moment a PDF cannot do. Switching to "Updated 3 Oct" morphs every changed figure on the page from its old value to its new one (the digits roll), sweeps a marigold highlighter mark across each from left to right, and slides the new news line in; switching back reverses it. The highlighter looks like a real marker stroke: slightly uneven edges, a little tilted, covering the whole height of the letters, not a neat rectangle. The stroke is solid, bright marigold (never see-through, so it stays bright on the green), and the marked words sit on it in dark fern green. The marks stay while the updated state is showing. The page opens on "Updated 3 Oct": about a second after load it plays the change once, from the 1 October values to the 3 October ones, so the reader sees the update happen. - The month in one sentence, set large. Updated: "Our best month: revenue up 9.4%, Quillmere signed, and burn held flat." As sent: "Our best month: revenue up 6.9%, and burn held flat." The words "Quillmere signed" slide in with the update and carry a highlighter mark. - The bottom 40 percent of the hero is a pale line chart of monthly recurring revenue for October 2025 to September 2026: a 3 px line with a soft fade beneath it, drawn on load, its small title "Monthly recurring revenue" aligned with the text above, inset from the edges so the first and last labels ("Oct 2025", and the end point's value) sit fully inside the screen. The end point is labelled with the current value, £61.2k updated or £59.8k as sent, and it moves when the version changes. No shaded column or band behind any month. On a phone the chart is at least 160 px tall. What changed between the two versions (all invented; these figures must agree everywhere they appear): - Monthly recurring revenue £61.2k, up 9.4% (as sent £59.8k, up 6.9%, an estimate). - Live sites 412, up 31 (as sent 404, up 23). - Runway 24 months (as sent 22 months). - A new news line, only in the updated version: "Quillmere Foods signed all 14 bakeries." The rest of the page, on a clean true off-white body (not cream): - Six numbers as a ledger, not cards: monthly recurring revenue, live sites, net revenue retention 118%, gross margin 81%, net burn £84k, runway. Each row has a twelve-month sparkline (October 2025 to September 2026) at least 140 by 36 px with a dot on its last point; the changed rows' last point moves with the version. Each row has a "Monthly values" control, styled as a clear button, that opens the twelve values and one sentence on what drove the number. - The news: two short lines of the month's other news, with the Quillmere line added at the top in the updated version. - A short letter from the founders: two wins, one thing that went badly (a delayed integration with a till system cost two pilots), and what they learned. - A hiring plan switch: Steady (3 hires, in December, February and April) or Accelerate (7 hires: two in October, then one a month to March). Model it month by month from October 2026, always from the updated figures: cash £1.70m on 30 September; revenue £61.2k growing 3.5% a month, or 6% a month from April 2027 on Accelerate; costs £145k a month plus £9k a month for each hire from their start month. Steady runs out in October 2028 after 24 whole months; Accelerate runs out in January 2028 after 15. Draw cash from October 2026 to December 2028 as a line chart at a fixed 16:7 aspect ratio (at most 480 px tall), with the chosen plan solid and the other plan a faint dashed line, both labelled by name at their line ends, a marked and labelled zero line, and a marked point where the chosen plan hits zero. Every axis label and line-end label sits fully inside the chart's box on a phone. The line moves smoothly between plans. State the month cash runs out and how many whole months come before it. The runway figure in the ledger is the Steady number. - The ask: we are raising £3m in the first quarter of 2027 so we can run Accelerate; three concrete asks (introductions to operations heads at restaurant groups with 20 or more sites, a view on our pricing, and early interest in the round), with a reply button to founders@fernhollow.example. - A note at the bottom that Fernhollow and Quillmere are fictional. Design: it should look like a sharp founder made it, not a template. Bricolage Grotesque for headings and figures with tabular numbers, Literata for the letter, from Google Fonts. Marigold is the only accent, used just for the highlighter. Generous space, a strong type scale, no drop shadows, no icons. Motion is calm and purposeful. For people who prefer reduced motion nothing animates: the page opens straight in the updated state with its marks, and the version and plan switches change instantly. Charts stay legible on a phone (labels at least 12 px on screen). Everything works by touch and keyboard, on a phone at 390 px wide with no sideways scrolling and on a large laptop screen. Add nothing this brief does not ask for.
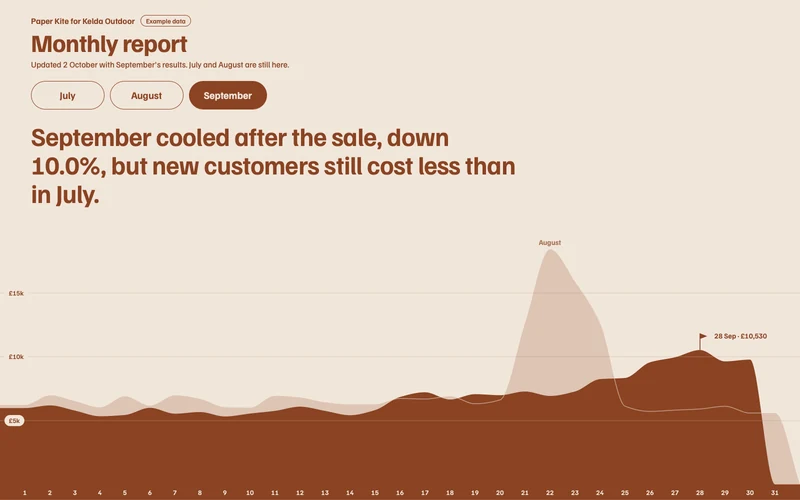
Monthly client report
For agencies who send each client the same report every month.
Open it live (Monthly client report, new tab)What a PDF cannot do
Each new month goes on the link the client already has; they switch months and compare with the month before.
The prompt, 1133 words
Make an agency's monthly client report as one self-contained HTML file, from Paper Kite, a growth agency, to Kelda Outdoor, an online shop for walking and camping kit. It is sent as one link to Kelda's Head of E-commerce and Marketing Director; every month the agency adds the new month to the same link. It now holds July, August and September 2026, and it was updated on 2 October with September's results. The one idea the whole page serves: each month is drawn as a mountain ridge made of its daily revenue, with last month's ridge behind it, so the client sees at a glance what changed. The first screen (the showpiece, fully visible without scrolling on a phone and a laptop): - The top part stacks compactly from the top, with no empty band: "Paper Kite for Kelda Outdoor" with an "Example data" label on the same line; "Monthly report"; a small line "Updated 2 October with September's results. July and August are still here."; then the month switch, three large buttons, July, August and September, opening on September. - One sentence for the month, set large. July: "July grew on the summer trail kit launch: revenue up 13.6%." August: "August was our best month: the Late Summer sale lifted revenue 25.5%." September: "September cooled after the sale, down 10.0%, but new customers still cost less than in July." - The ridge fills everything below to the bottom edge and runs the full width of the screen, edge to edge, on a phone and on a laptop, at least 200 px tall on a phone. The month's daily revenue is drawn as a smooth filled ridge, the day of the month along the bottom (1 to 31 for every month; September's ridge ends at day 30), inset so no label is cut off. The previous month's ridge sits behind it as a paler filled silhouette, like a farther mountain range, labelled with its month's name, so the difference shows; where it is hidden behind this month's ridge, its top edge carries on as a faint pale line across the front ridge. The vertical scale starts at zero and tops out just above the higher of the two ridges on screen, so every month's ridge fills the space; two or three faint gridlines at round values (such as £5k and £10k) show the scale and move with it; each label sits at the left end of its line on a small rounded pill of the hero's pale background colour, so it reads wherever the ridge is. The month's highest day is marked with a small flag on its peak, labelled with its date and value. Switching months morphs the ridge into the new month's shape, moves the flag, rolls every figure on the page to the new month's values and shifts the hero's colours to the month's season: July moss green (#3E5B3A on #E9EEDF), August heather (#5E4466 on #F3EAD7), September bracken rust (#8A4323 on #F1E6DA). Everything below the hero stays on plain off-white; only its small accents take the month's colour. - Daily revenue, generated from a fixed seed and then scaled so each month's days add exactly to its total, rounded to £10, with the rounding difference on the peak day: July a gentle rise from the 15th, when the summer trail kit launched; August a sharp peak across the 21st to the 24th, the Late Summer sale, highest on the 22nd; September lower in the first half, rising from the 24th, when the autumn jacket range launched. June is used only as July's back ridge, generated the same way from its total with no peak. The figures (all invented; they must agree everywhere): - June (for comparison only): revenue £162,000, ad spend £38,000, new customers 1,880. Paid social £61,000, search £58,000, e-mail £43,000. - July: revenue £184,000, ad spend £41,000, new customers 2,140. Revenue by channel: paid social £72,000, search £64,000, e-mail £48,000. - August: revenue £231,000, ad spend £46,000, new customers 2,690. Paid social £98,000, search £74,000, e-mail £59,000. - September: revenue £208,000, ad spend £44,000, new customers 2,310. Paid social £76,000, search £71,000, e-mail £61,000. - Shown as four headline numbers, each with the change on the month before in words and figures ("up 13.6% on June"): revenue; return on ad spend (revenue ÷ spend, one decimal: June 4.3, July 4.5, August 5.0, September 4.7); new customers; cost per new customer (spend ÷ new customers: June £20.21, July £19.16, August £17.10, September £19.05). Changes: July on June, revenue up 13.6%, new customers up 13.8%, cost per new customer down 5.2%; August on July, up 25.5%, up 25.7%, down 10.7%; September on August, down 10.0%, down 14.1%, up 11.4%. Below the hero, all following the month switch: - The four headline numbers, as a clean row, not cards. - Channels: three horizontal bars, this month's revenue per channel with last month's as a thin marker on each bar, and the change beside it. One short line above the bars says the bar is this month and the thin line marks last month. All three bars share one scale, set by the largest channel value of the two months, so every bar and every marker stays inside its track. - What we did and what changed: three short notes from the agency for the month, "What worked", "What did not" and "What we changed". Invent specific, believable notes for each month that match its numbers (for September: the sale's end, a cheaper search audience, and a paid social creative that tired). - Next month: for September, the plan for October in three lines; for July and August, what was planned and whether it happened. - A note at the bottom that Paper Kite and Kelda Outdoor are fictional. Design: a thoughtful agency's report, calm and outdoorsy, not a template and not a dashboard. Familjen Grotesk for headings and figures with tabular numbers, Source Serif 4 for the agency's notes, from Google Fonts. A strong type scale, generous space, hairline rules, no drop shadows, no icons. Each section opens with its headline alone, with no small capital label above it. Chart labels at least 12 px on a phone. Below the hero, each section has at least 96 px of space above its headline on a laptop and 64 px on a phone. September's ridge slopes down to the baseline after day 30, as August's does after day 31. Motion is calm; for people who prefer reduced motion nothing animates: the months, the ridge, the figures and the colours change instantly. The month buttons are real buttons with the chosen one announced, and everything works by touch and keyboard, on a phone at 390 px wide with no sideways scrolling (nothing, including a hidden or animating element, may reach past the right edge of the screen) and on a large laptop screen. Add nothing this brief does not ask for.
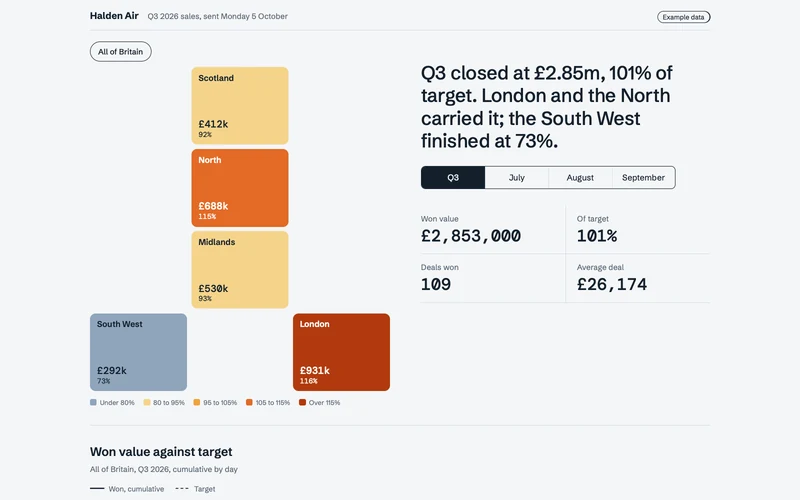
Quarterly sales dashboard
For sales leads whose numbers go to regional managers who each care about one region.
Open it live (Quarterly sales dashboard, new tab)What a PDF cannot do
Tap a region on the map and the headline numbers, the chart and the deals table all change to that region.
The prompt, 1015 words
Build a quarterly sales dashboard as one self-contained HTML file with no external libraries, for Halden Air, which sells heat pumps, heating controls and service plans to schools, offices and care homes in Great Britain. The sales operations lead sends it on Monday 5 October 2026 to the five regional sales managers, and each of them cares about one region. The one idea the whole page serves: the map is the filter. Britain is drawn as five region tiles coloured by how hot each region's quarter ran against its target, and tapping a tile changes everything on the page. The data (all invented; every figure on the page is computed from it, so the sums always agree): - Q3 2026, 1 July to 30 September. Won value and target by region: Scotland £412k of £450k; North £688k of £600k; Midlands £530k of £570k; London £931k of £800k; South West £292k of £400k. Britain: £2,853k of £2,820k, which is 101%. Each month's target is a third of the region's quarter. Won value by month (July, August, September): Scotland £128k, £131k, £153k; North £214k, £226k, £248k; Midlands £181k, £164k, £185k; London £283k, £298k, £350k; South West £104k, £88k, £100k. Britain by month: £910k, £907k, £1,036k. - Generate the won deals from a fixed seed: about one deal per £26k, values between £6k and £95k, each with an account, a region, a product (Heat pumps, Controls or Service plan), and a close date on a weekday. Then scale each region's deals in each month so they add up exactly to that month's won value, rounded to £100, putting any rounding difference on the largest of those deals. No account name appears twice within a region. Account names come only from this invented list, combined with a type (Academy, Primary, Offices, Care Home, Leisure Centre, Medical Centre): Brackwell, Oxmere, Tallowcross, Fennick, Wyndle, Lornby, Carrowvale, Istley, Peverham, Sallowgate, Hobbin, Quarrendon Vale, Marlstone, Edgewick, Thornacre, Upperby Mill. The first screen (the showpiece, fully visible without scrolling on a laptop; on a phone the tiles are within the first screen): - A top line: "Halden Air", "Q3 2026 sales, sent Monday 5 October" and an "Example data" label. - One summary sentence, large, that changes with the selection. For all of Britain and the whole quarter: "Q3 closed at £2.85m, 101% of target. London and the North carried it; the South West finished at 73%." For anything else, the same shape built from the numbers, for example "Scotland closed Q3 at £412k, 92% of its £450k target." - A period switch: Q3, July, August, September. - The map: five equal, nearly square tiles with rounded corners on a three-column grid laid out like Britain: Scotland in the middle column of the first row, North in the middle of the second, Midlands in the middle of the third, and in the fourth row South West in the left column and London in the right, the other cells left empty. The map is at least 420 px wide on a laptop and full width on a phone. Above the map, a small "All of Britain" button, outlined when it is the selection. Each region tile shows its name, its won value and its percentage of target for the chosen period, and is filled on a heat scale by that percentage: under 80% cool slate blue (#8FA5BC), 80 to 95% pale amber (#F5D48A), 95 to 105% amber (#F0A23A), 105 to 115% orange (#E36A26), over 115% deep ember (#B23A0E), with ink text on the three lighter fills and white text on the two darker. A small legend under the map names the five bands. The chosen tile gets a thick ink outline; tapping it again goes back to all of Britain. When the period changes, the tiles recolour smoothly. - Four headline numbers for the selection: won value, percentage of target, deals won, and average deal size. They change with every tap, rolling to their new values. - On a laptop the map sits left and the sentence, the period switch and the four numbers stack directly under one another on the right, with no empty band between them; on a phone the sentence, the period switch, the map (full width, tiles at least 64 px tall), then the numbers two by two. Then: - A chart, "Won value against target", of the selection's cumulative won value day by day across the chosen period as a stepped line, its vertical axis topping out at the round number just above the higher of the won value and the target, with the target as a straight dashed line rising from zero to the period's target, and a marked point where the won line crosses the target, if it does. The x axis names the months or the weeks; labels at least 12 px on a phone; the chart keeps a fixed 16:9 shape. - A table of the selection's won deals, largest first: account, region, product, close date and value. It shows the ten largest with a "Show all" button giving the count, and a total row that always equals the headline won value. - A note at the bottom that Halden Air and every account are fictional. Design: a precise, quiet instrument that lets the heat colours do the talking. Cool paper background (#F4F6F8), deep ink (#14202B), hairline rules, and colour only in the heat scale. Schibsted Grotesk for headings and text and DM Mono for figures, from Google Fonts. Tabular numbers only on the figures in DM Mono; the summary sentence and every heading are set in Schibsted Grotesk with its normal punctuation spacing. No cards around the numbers, no drop shadows, no icons, no gradients. Each section opens with its headline alone, with no small capital label above it. Motion is short and purposeful; for people who prefer reduced motion nothing animates and every change is instant. Tiles, the period switch and "Show all" are real buttons with their state announced, and work by touch and keyboard, on a phone at 390 px wide with no sideways scrolling (the table may scroll inside its own box) and on a large laptop screen. Add nothing this brief does not ask for.
Read our sample deck. See which part you read.

How these were made and sent
- Made in Claude.
- Each page is one HTML file that Claude wrote from the prompt shown. Every document says “Example data” at the top.
- Sent through HTMLRadar.
- Each was uploaded and given its own link. These links are open to anyone so you can try them; yours can be limited to named people or your company, with a code sent to each reader.